SatFish’s high-def sea surface temperature (SST) charts show where the water temperature is just right for offshore gamefish such as tuna, marlin, mahi mahi (aka dolphin or dorado), and wahoo. These fishing charts are a critical tool to help offshore anglers make the most of their time on the water by allowing us to focus our fishing effort in areas that are more likely to hold our target species.
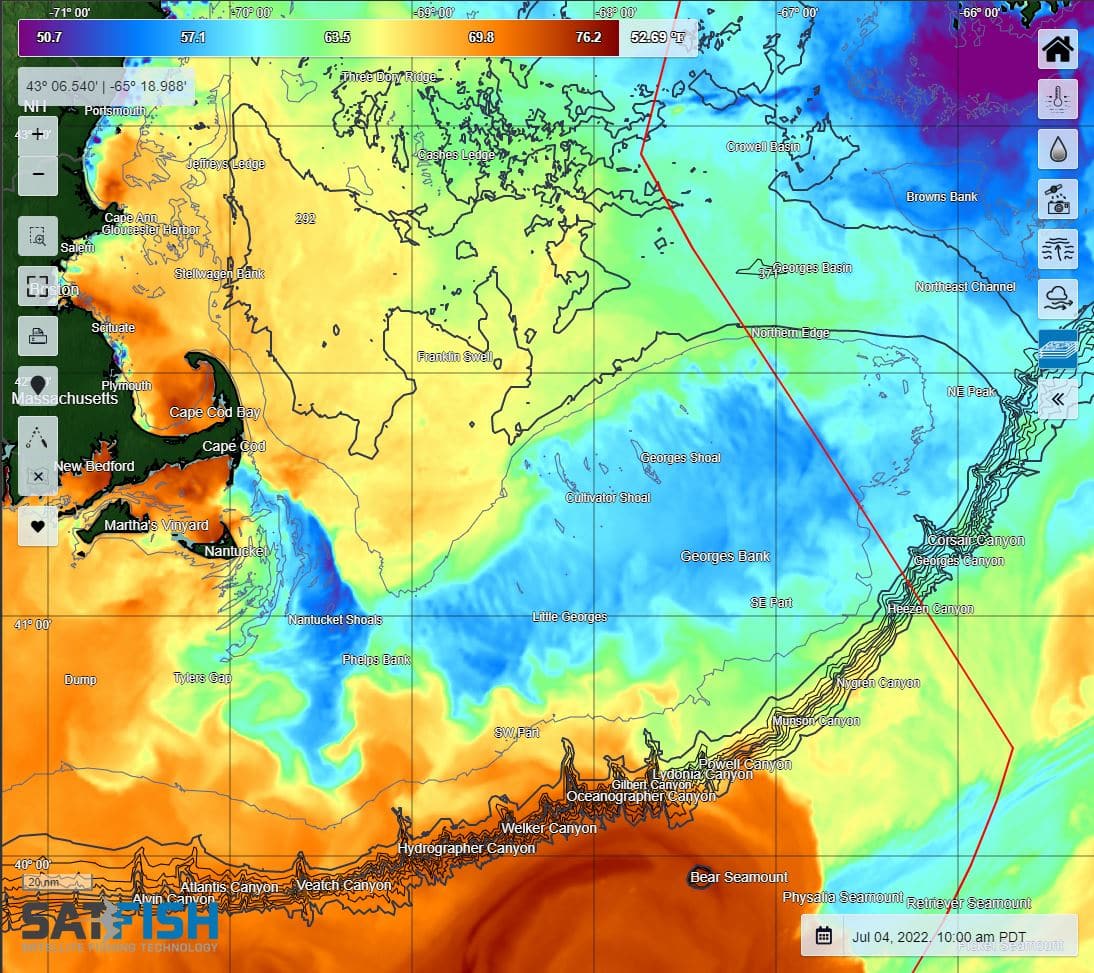
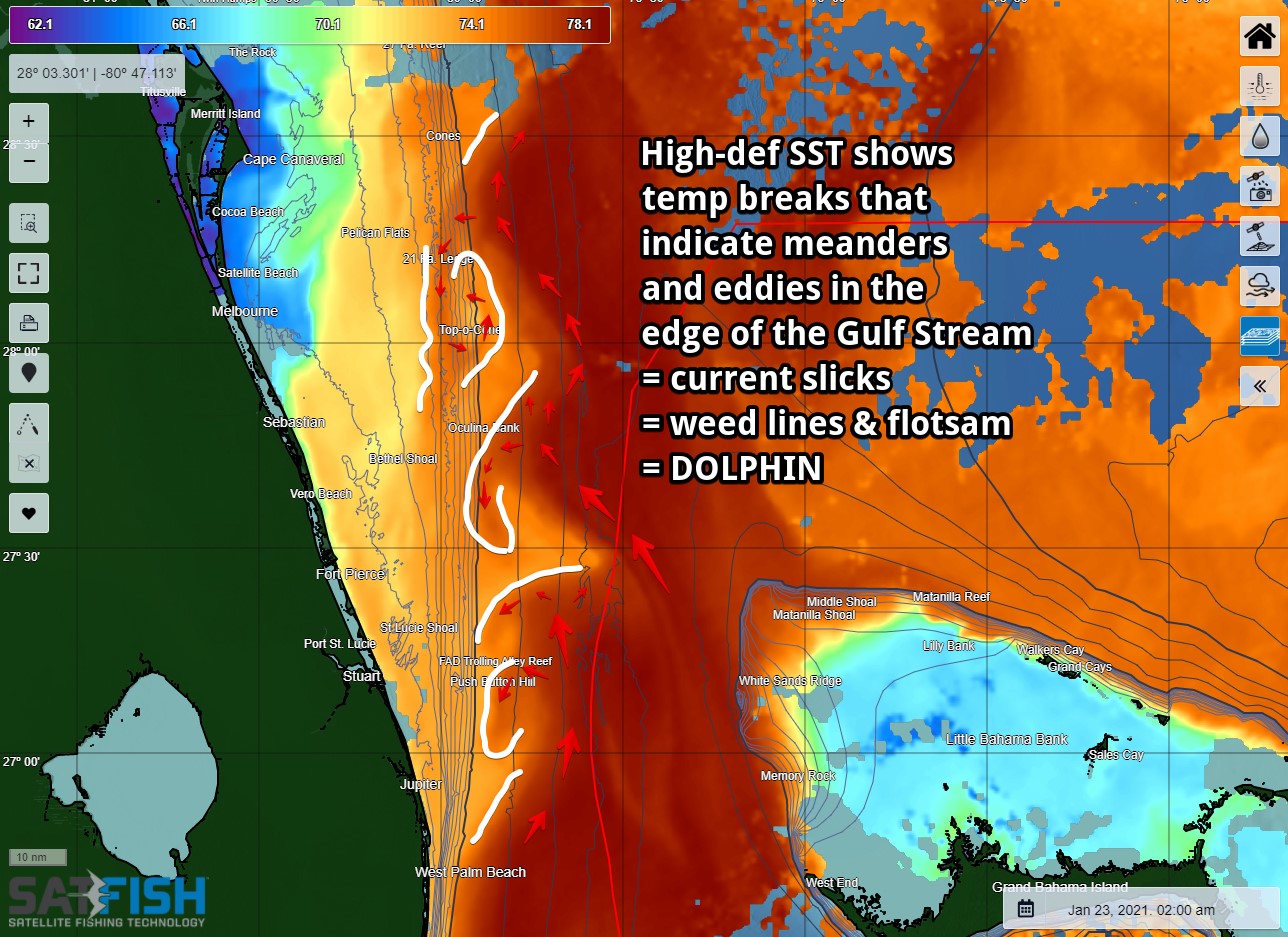
Sea surface temperature breaks – where the ocean temperature warms up or cools off quickly over just a few miles – also mark oceanic “edges” of water masses and currents that congregate bait fish, kelp, weed lines and sea life, meaning that’s where gamefish are going to gather and feed.
Find the break, find the structure and you’ll find the fish.
These SST charts are made by several satellites orbiting the Earth that measure the infrared heat signature from the water’s surface. Our in-house expert with a PhD in marine science processes all the data for our fishing charts with our own custom filtering and analysis routines, delivering accurate SST images at the highest resolution possible as soon as possible after each satellite passes overhead. In clear-sky conditions, we can generate up to 8-12 SST images daily, giving you near-constant coverage around the clock.
Although these SST charts are great for showing sharp edges and temperature breaks in high-def resolution, the temperature data signal gets “blocked” by clouds and fog, so accurate SST measurements can only be made in clear-sky conditions. SatFish’s advanced cloud-masking routines allow us to show the highest quality data with maximum coverage, making full use of all the clear data pixels. Areas of cloud cover, fog, and other interference yielding inaccurate or low-quality data get filtered out and show up as “blank” areas on the map. For some regions we also offer an unfiltered “raw” SST which shows even more coverage of sharp temperature breaks, such as along the edges of the Gulf Stream.
Fortunately, clouds move! Even if the most recent SST map only has spotty data due to lots of cloud cover over the ocean, chances are skies were clear over your target zone within the last few days. We archive a full week’s worth of SST shots to give you plenty of images to find one with a clear view of ocean temps. You can easily scroll through the latest week’s worth of images with thumbnail previews, allowing you to choose the ones with the best data coverage for your area.
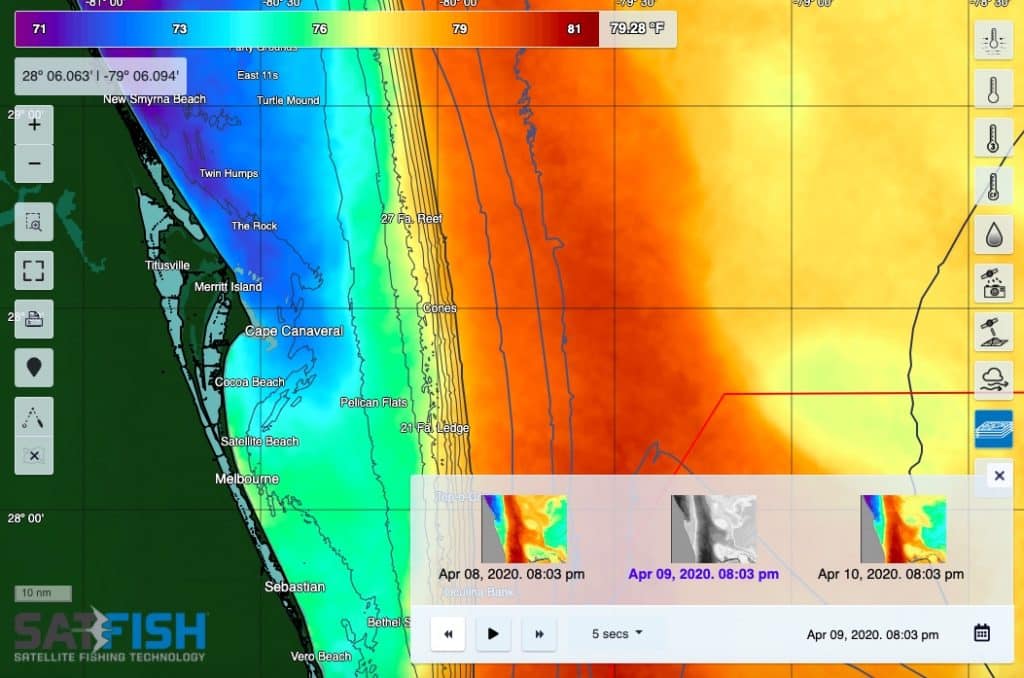
Pro Tip: Scrolling through the map history, and using the “play” button to advance the map images through time automatically, also helps you visualize how temp breaks and water masses are moving from day to day, so you can predict where they’re going to be later in the day or even the next day when you’re out fishing!
During extremely cloudy conditions, anglers can utilize our Cloud Free SST Images and multi-day SST Composites to get an overview of the conditions in the region. These maps blend data from multiple sources and don’t always give the high-def resolution for edges and temp breaks, but they’re still a very useful tool to get a general idea of where water temps are right for your target species.
Data courtesy of NASA PO.DAAC, GHRSST, & NOAA Coastwatch. Not to be used for navigation.
How do sea surface temperature charts help me catch more fish?
Sea surface temperature (SST) charts show where water temperatures match the preferred range of species like tuna, marlin, mahi, and wahoo. They also reveal temperature breaks and current edges where baitfish gather. When you find the right temp and structure, you dramatically increase your odds of finding feeding gamefish.
What is a temperature break, and why is it important for fishing?
A temperature break happens when ocean water changes temperature quickly over a short distance. These breaks create feeding zones that attract baitfish, weed lines, and predators. Offshore anglers often target these edges because that’s where gamefish concentrate.
How often are SatFish SST maps updated?
In clear-sky conditions, SatFish can generate up to 8–12 SST images per day. This gives anglers near real-time updates on shifting temperature breaks and water masses. Frequent updates help you track movement and plan your trip more effectively.
Why do some areas on the SST map appear blank?
Clouds and fog block satellites from accurately measuring infrared heat at the ocean surface. When data quality is low, those areas are filtered out to prevent misleading readings. You can check previous days’ images to find clearer views of your fishing grounds.
What should I do if it’s too cloudy for a clear SST image?
During heavy cloud cover, anglers can use Cloud Free SST images or multi-day composite maps. These blend data from multiple passes to provide broader coverage. While they may not show ultra-sharp edges, they still help identify productive temperature zones.
How can I use SST map history to predict fish movement?
By scrolling through archived images and animating the map, you can see how temperature breaks move over time. Tracking these shifts helps predict where edges will form next. This gives offshore anglers a strategic advantage before leaving the dock.