
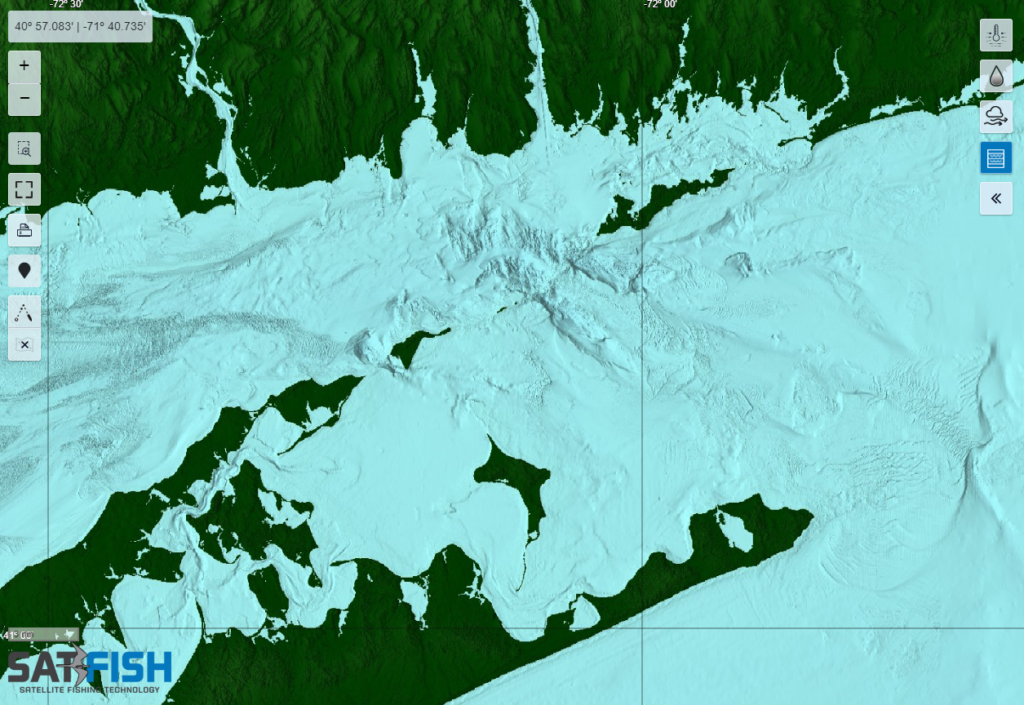
SatFish uses custom bathymetry maps to give you a detailed view of the seafloor. Every canyon, ledge, pinnacle, and seamount is easy to find on our shaded-relief maps. Shallow waters are pale blue, turning to darker blue and purple as the seafloor gets deeper. You can even see “textured” hardbottom and rocky reef areas next to smooth, flat sand or mud bottoms. These underwater features provide important habitat for baitfish and gamefish alike. In the open ocean, pinnacles and seamounts also create areas of upwelling where currents push to the surface, bringing vital nutrients, plankton, and life with them.
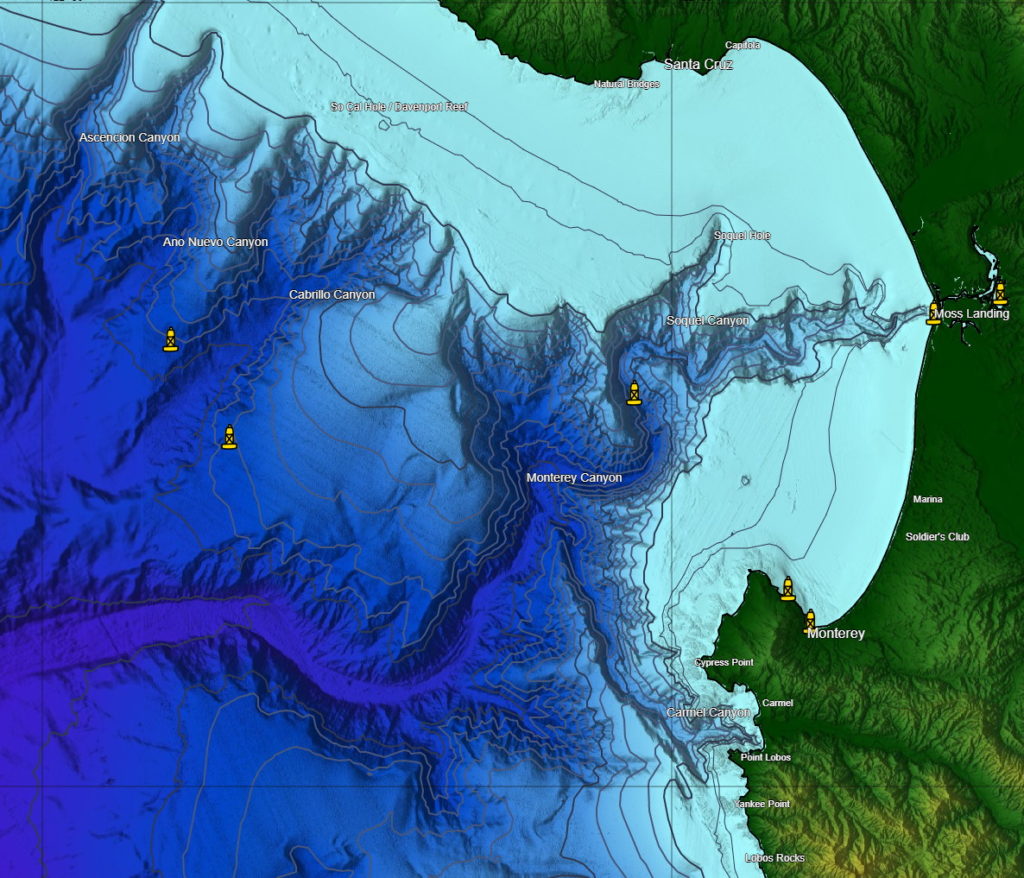
We include major depth contours to highlight steep drop-offs and shallow flats. The closer the contour lines are to each other, the steeper the dropoff. Our primary contour lines follow the 100-, 500-, 1000-, 1500-, and 2000-fathom depths, with additional contours on zoomed-in regions. Some species tend to associate with certain depths and underwater features, so viewing our detailed bottom maps and contours right with the temperature and chlorophyll maps can help you target productive waters when they move over these important depth zones.
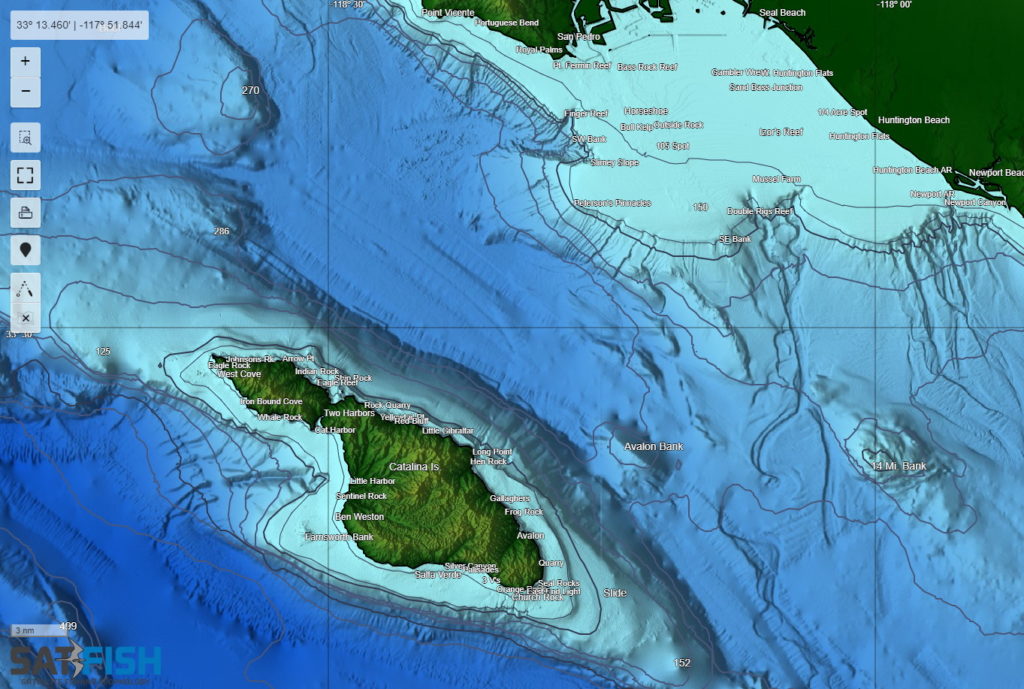
We also have thousands of the best fishing spots labeled on our charts. These aren’t some random lists of coordinates scraped from the internet – these are the legit, real-deal spots carefully curated by our team of local experts. Combined with continuous GPS coordinate display wherever you tap or move your cursor, it’s easy to find your favorite hot spots on our map and clearly see when that temperature edge or color break has pushed into your zone.
Data courtesy of Seafloor Mapping Lab at California State University, Monterey Bay; U.S. Geological Survey; NOAA National Centers for Environmental Information; and GEBCO Compilation Group (2024). Not to be used for navigation.
Frequently Asked Questions
What is bathymetry and why is it useful for fishing?
Bathymetry maps show the shape and depth of the seafloor, including canyons, ledges, drop-offs, pinnacles, and seamounts. These structures create habitat and current-driven “fish highways” where bait and gamefish often gather.
How do I read SatFish’s bathymetry colors?
Shallow areas appear pale blue, and deeper water shifts into darker blue and purple. The shaded relief also helps you spot bottom texture, like hardbottom/reef next to smoother sand or mud.
What do depth contours mean on the map?
Depth contours are lines that mark the same depth, and they make steep terrain easy to see. When contour lines are close together, it means a sharper drop-off, often a productive zone when current and bait line up.
Which depth contours does SatFish highlight most?
SatFish commonly highlights major contours at 100, 500, 1000, 1500, and 2000 fathoms, with extra contours in zoomed-in areas. These depth zones help you track where certain species like to hold as conditions change.
Why do seamounts and pinnacles matter offshore?
Pinnacles and seamounts can trigger upwelling, where currents push nutrient-rich water toward the surface. That boost in nutrients can build plankton, attract bait, and turn the area into a feeding spot for pelagic fish.
Are SatFish fishing spots just random coordinates?
No. SatFish hot spots are curated by regional experts, not scraped lists from the internet. Pair those labeled spots with live GPS readouts and overlays like SST and chlorophyll to see when a temp edge or color break slides into your zone.