Winter on the North Carolina coast often means cold air, short days, and fewer boats at the dock. But offshore, the story is very different. Out in the Gulf Stream, the water is still warm, active, and absolutely capable of producing wahoo all winter long. The challenge isn’t whether the fish are there — it’s knowing where to start looking.
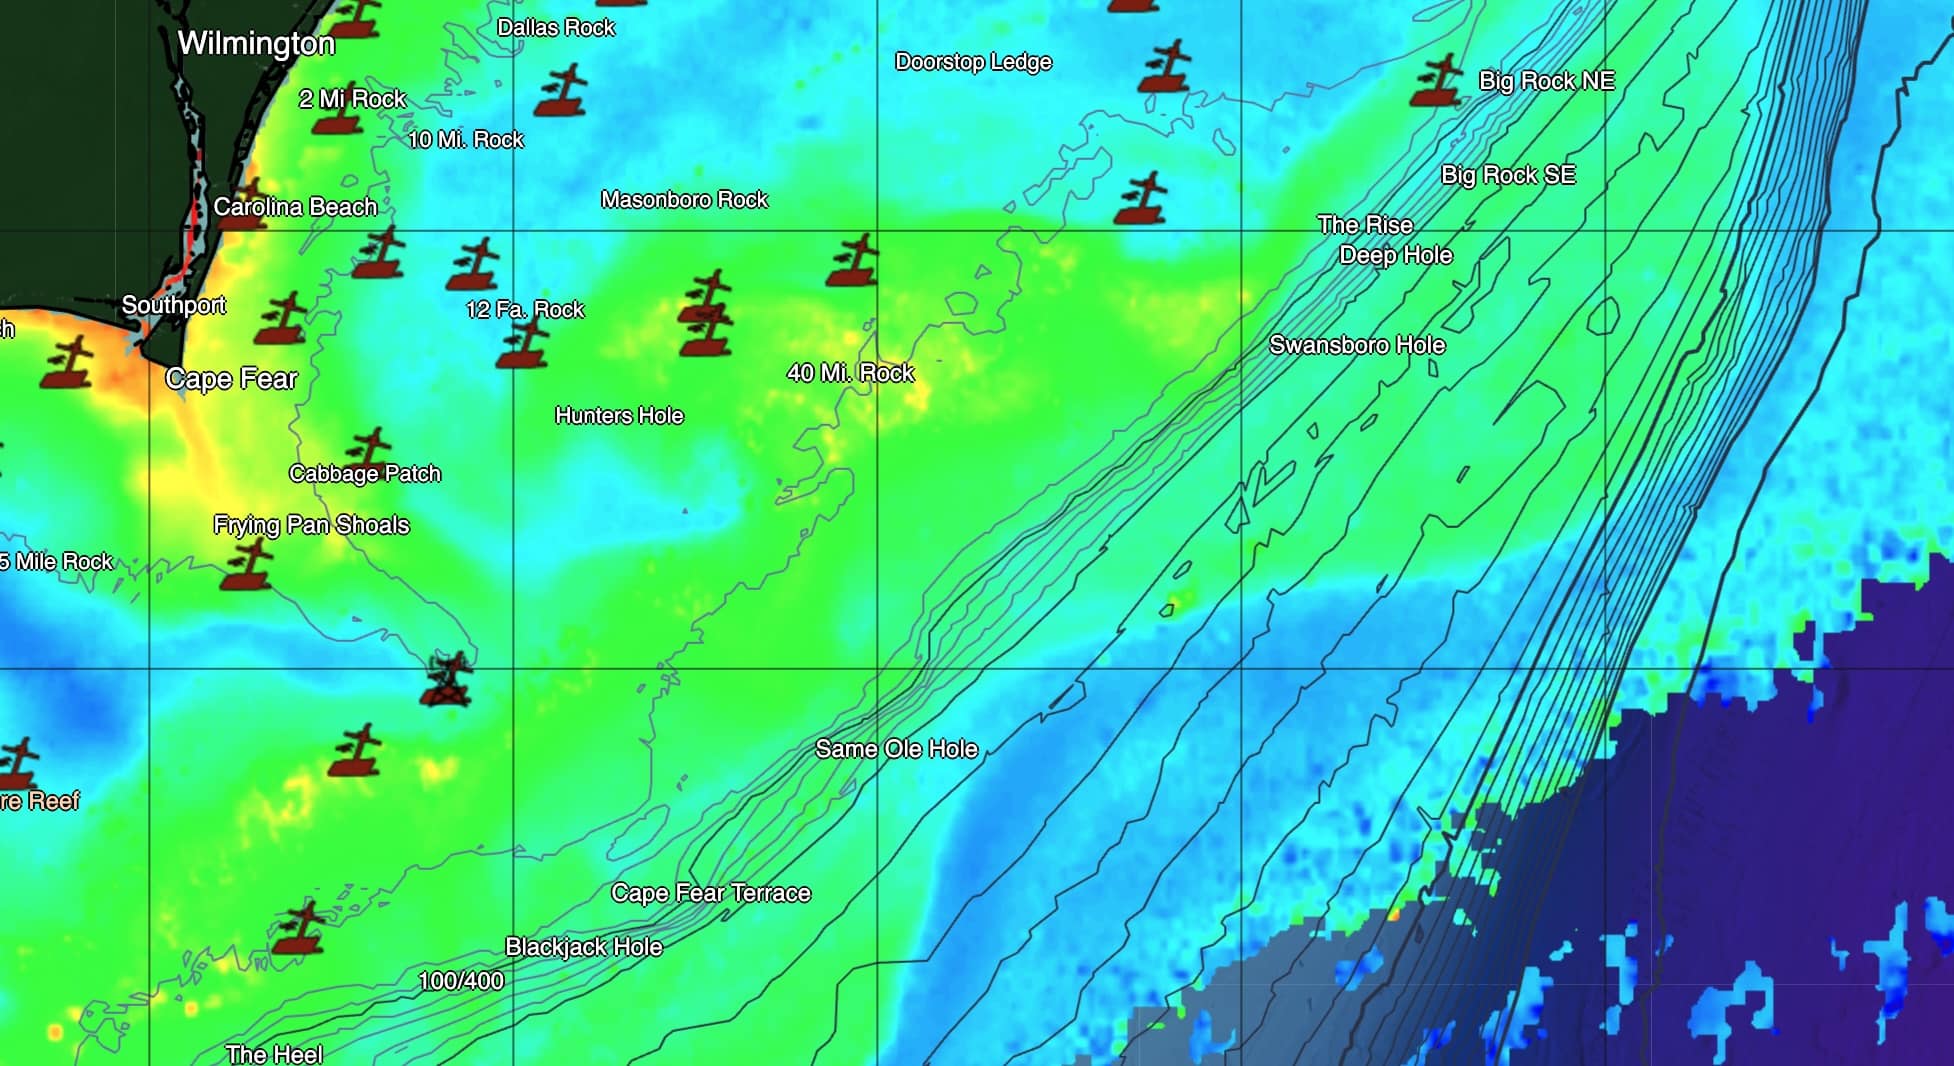
Fishing out of Carolina Beach, my first step in winter trip planning is always sea surface temperature (SST). Just because it’s cold on the beach doesn’t mean the Gulf Stream has shut down. In fact, that contrast between cold shelf water and warm offshore water often creates some of the cleanest, most defined edges of the year.
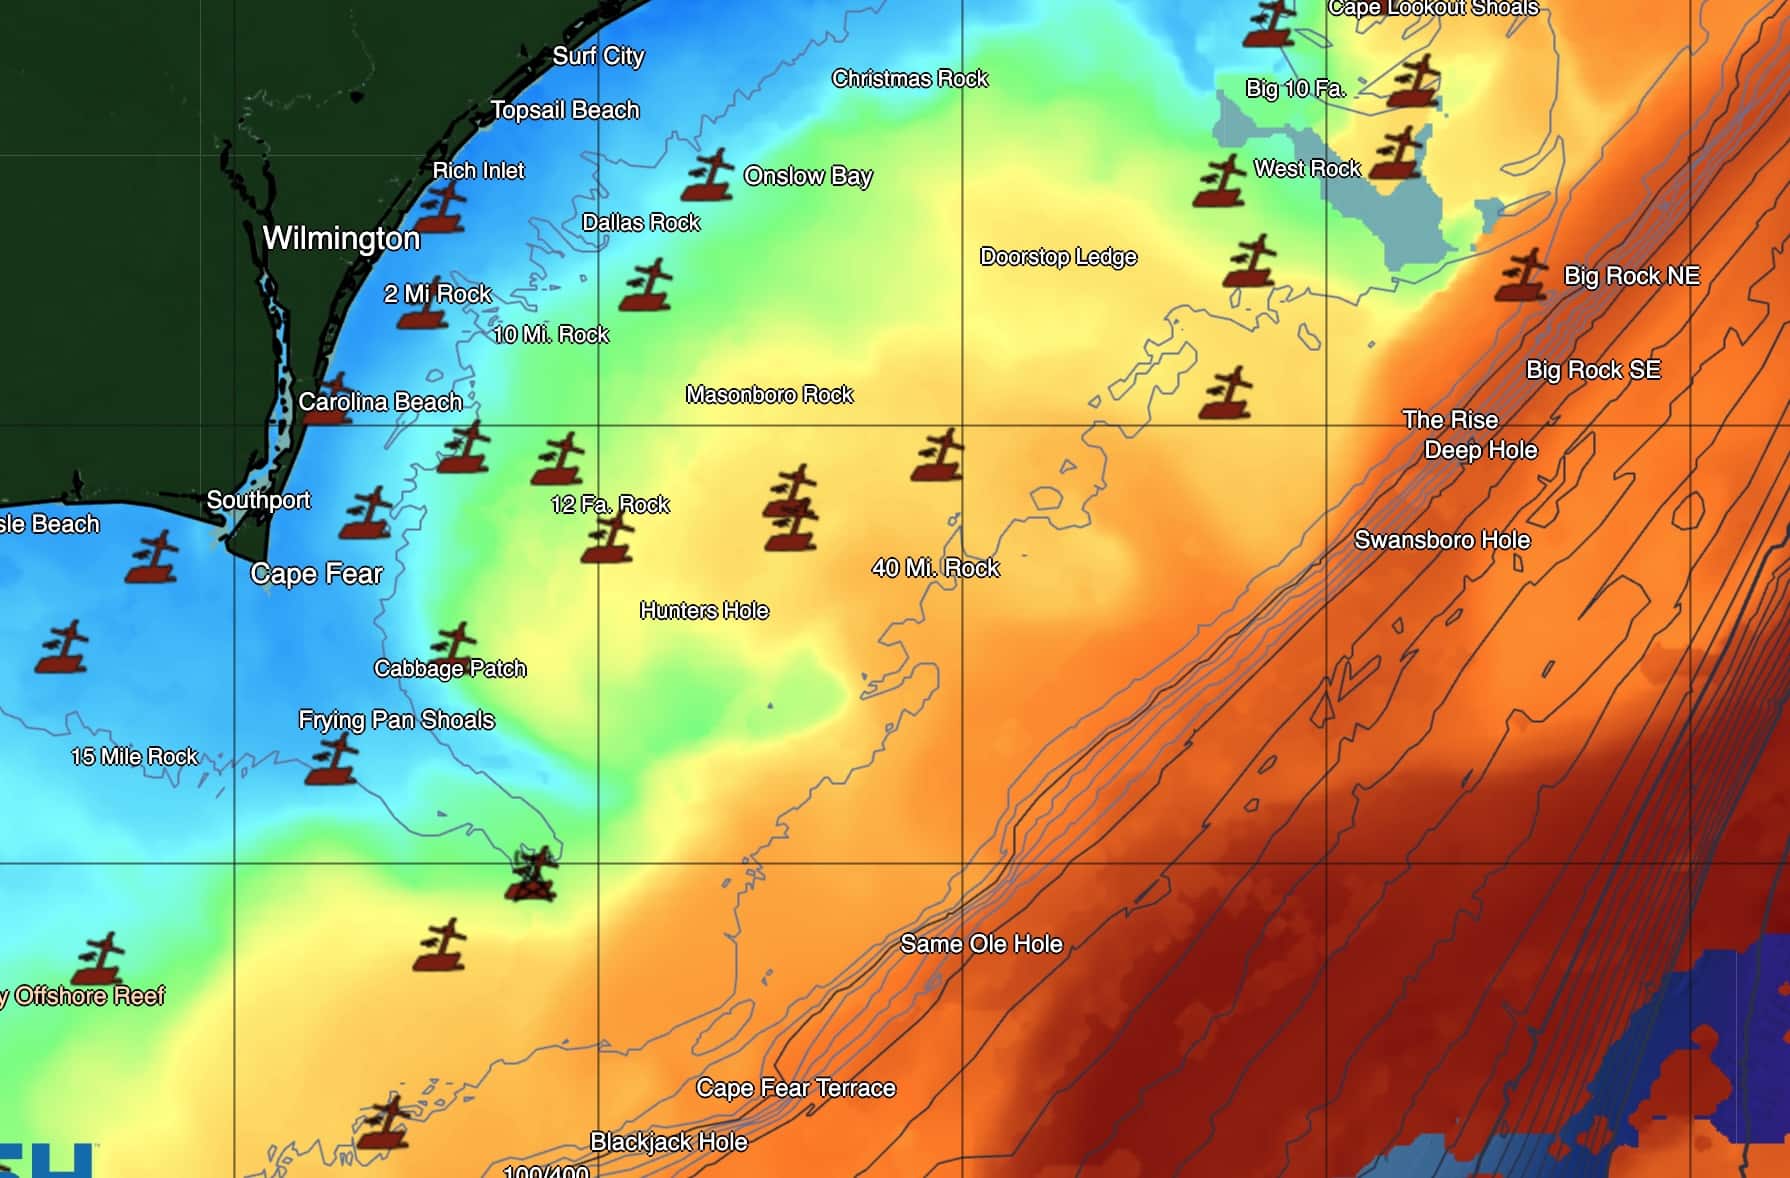
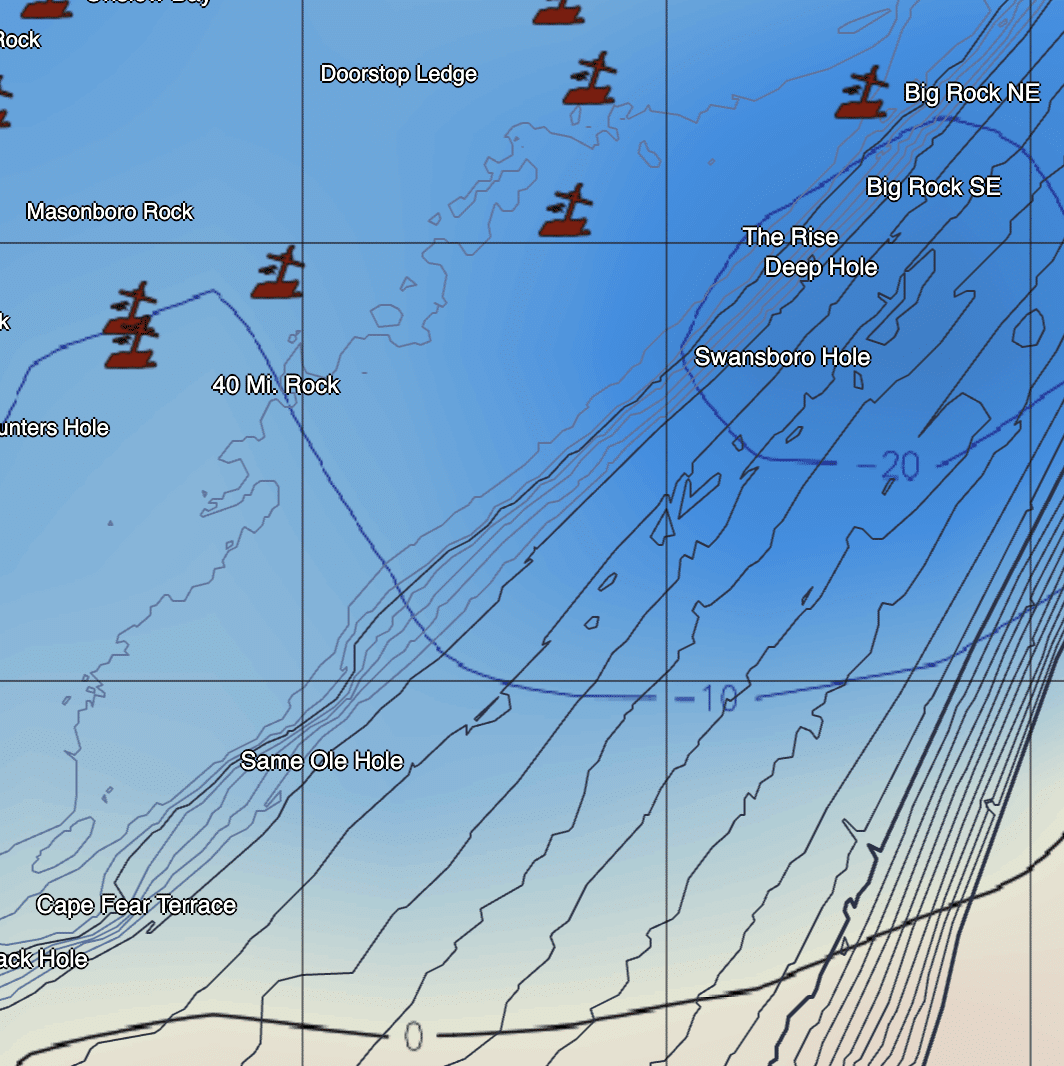
Using SatFish, I start by identifying the warmer bands of water that mark the Gulf Stream and its edges. In my typical winter range — from Swansboro Hole through Same Ole Hole, the Nipple, the Steeples, and the 100/400 Blackjack area — I’m looking for clear temperature gradients. These don’t have to be massive swings. Sometimes a few degrees over a short distance is all it takes to create a productive edge.
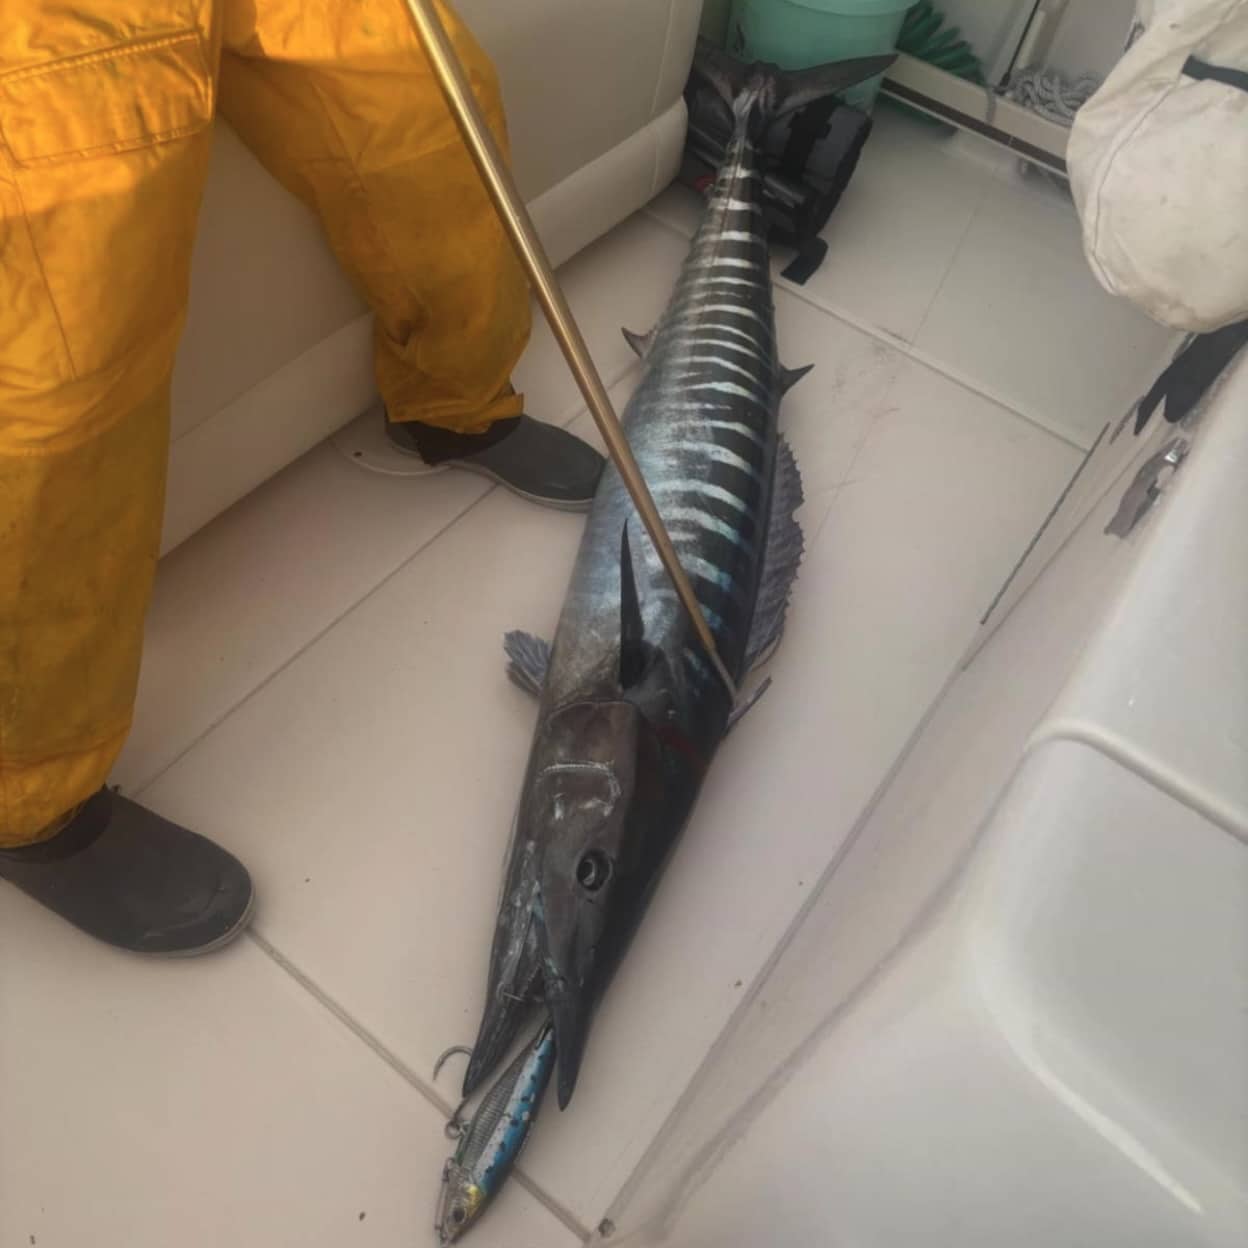
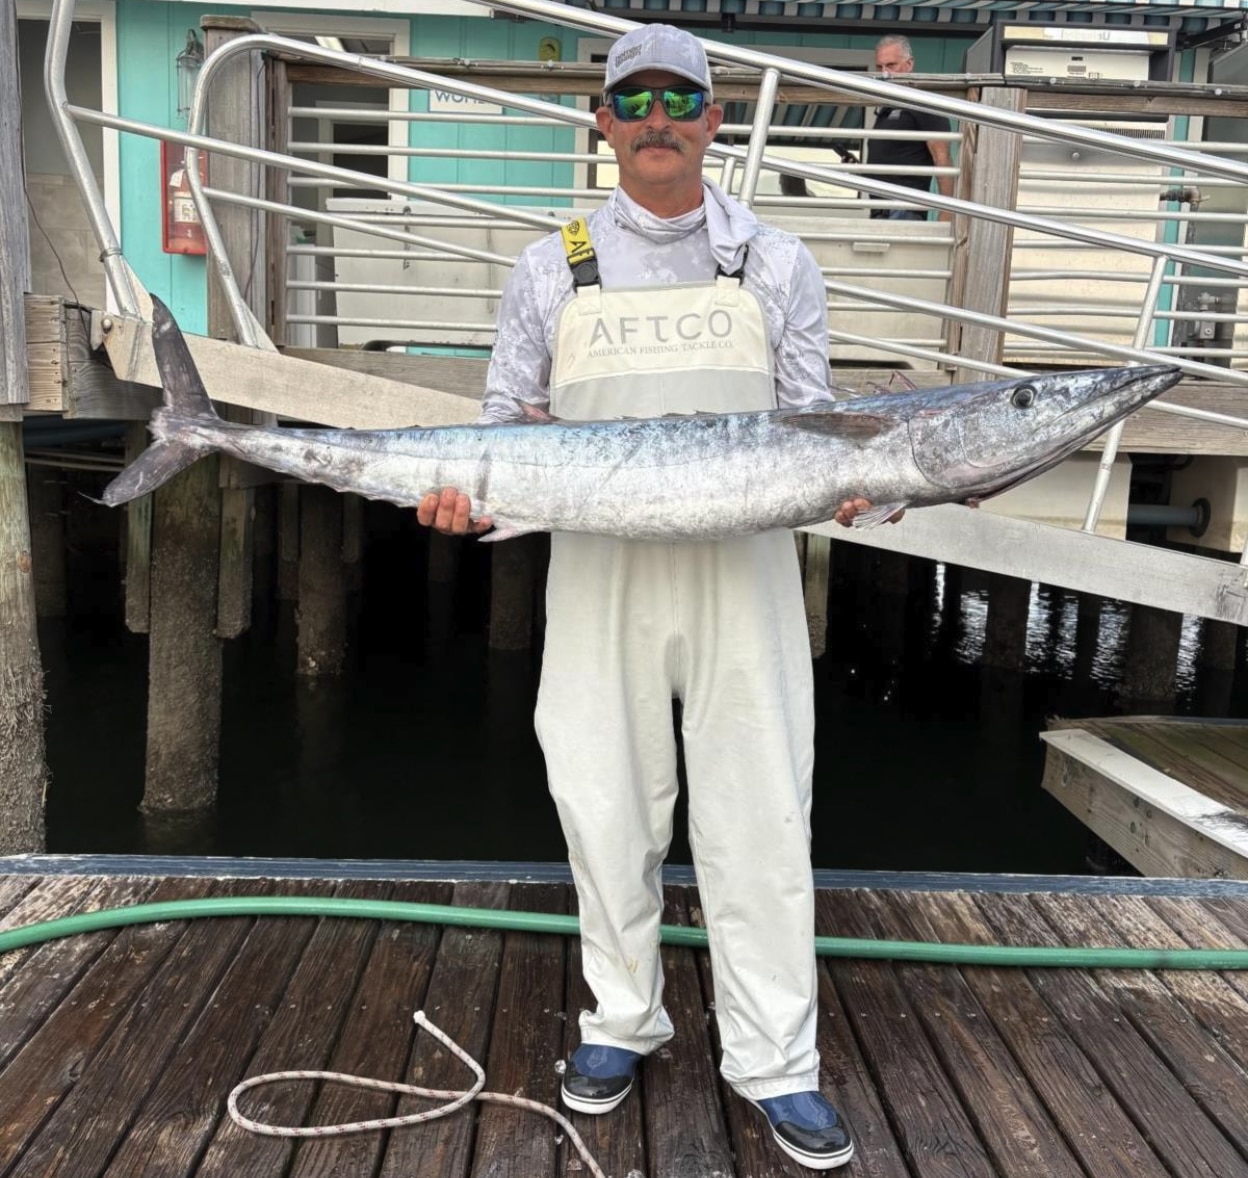
A good temperature break gives pelagic fish a highway to travel and hunt. Wahoo, in particular, love these edges because they naturally concentrate bait and provide an efficient place to feed. On a recent winter run, finding the right SST edge put us on a wahoo within minutes of setting lines — a perfect example of how powerful SST alone can be when used correctly.
Sea surface temperature doesn’t tell the whole story, but it tells me where to begin. In the next section, I’ll explain how I take that temperature break and determine whether it actually holds life by layering in chlorophyll data.
Layering Chlorophyll: Enhancing Your Winter Wahoo Strategy with SatFish
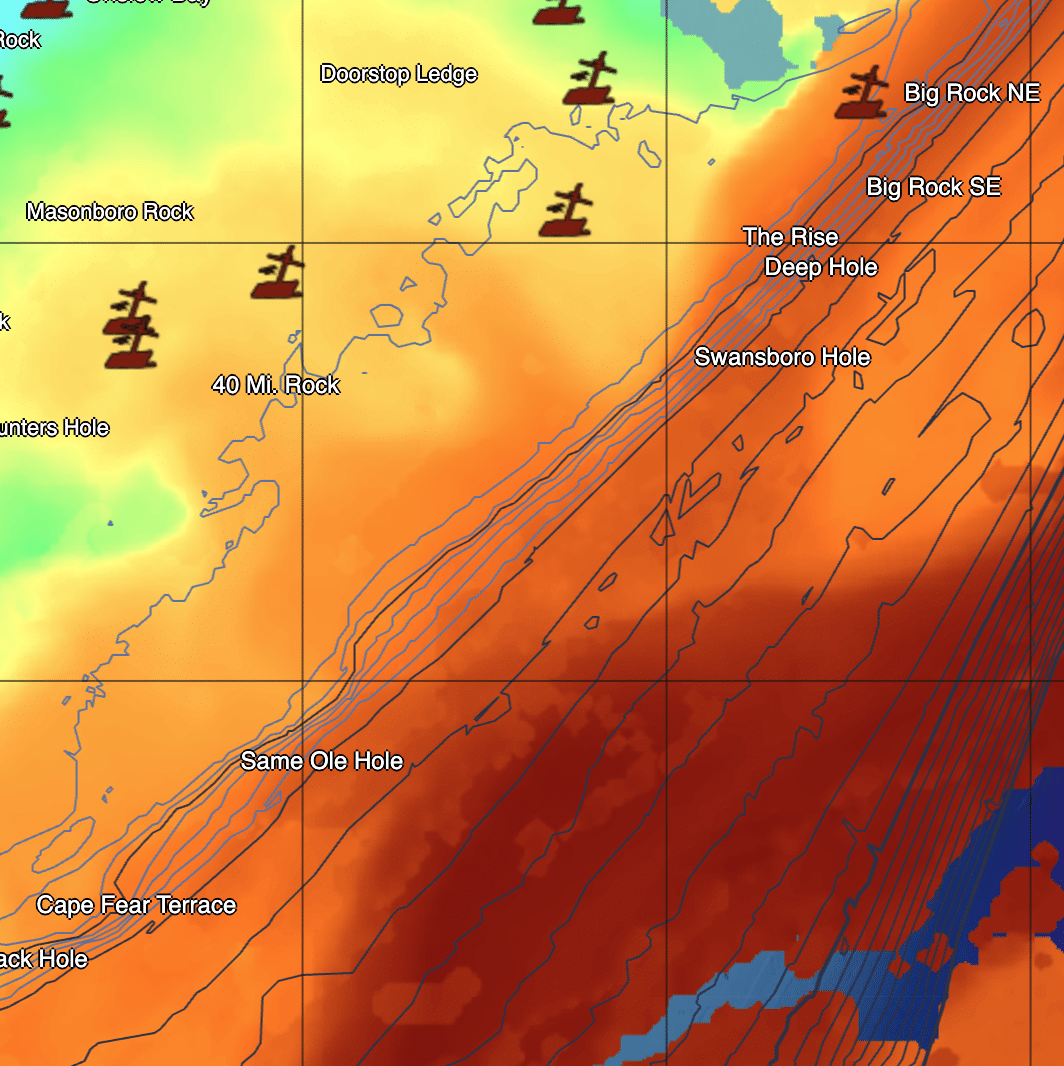
Once I’ve identified a promising temperature break using SST, the next question is simple: is there actually life there? That’s where chlorophyll comes into play.
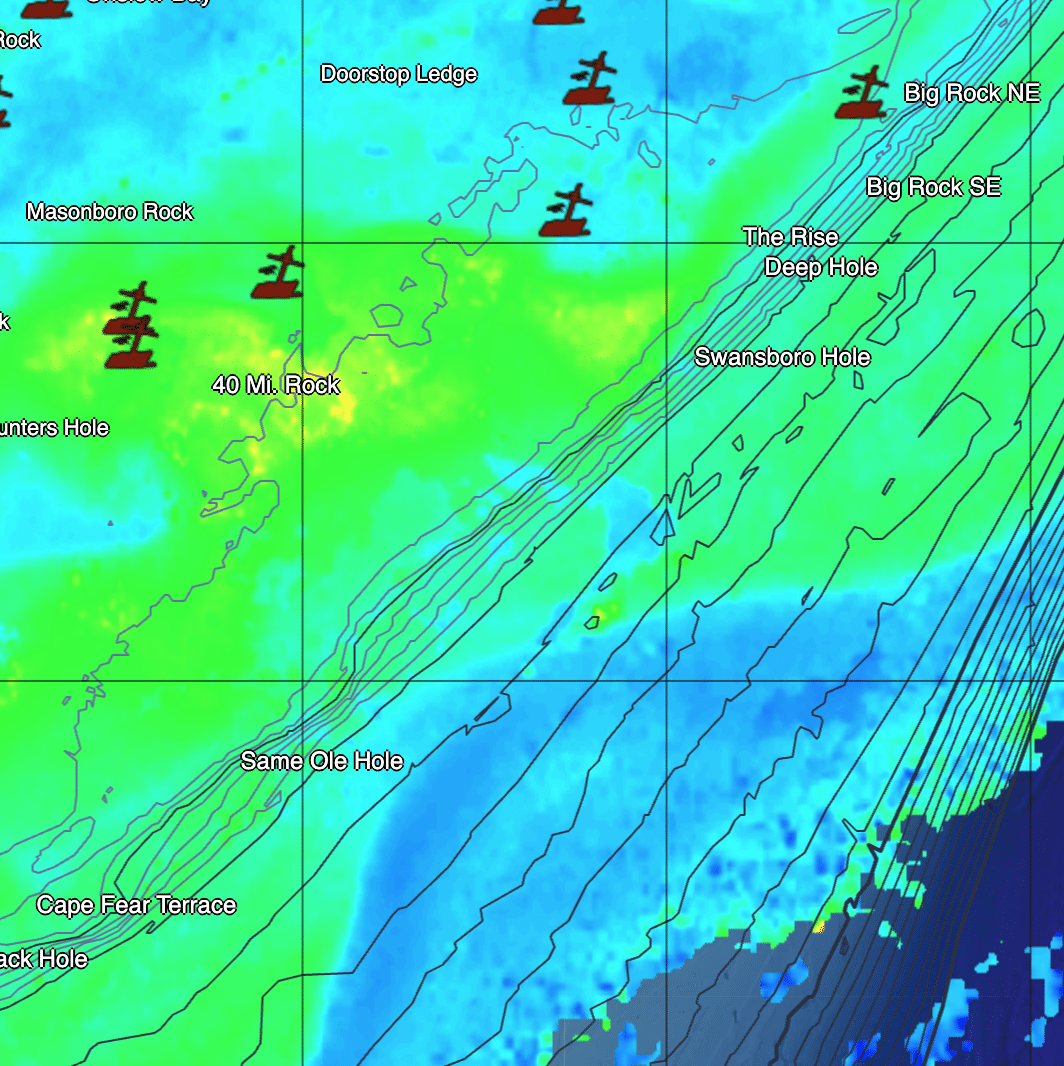
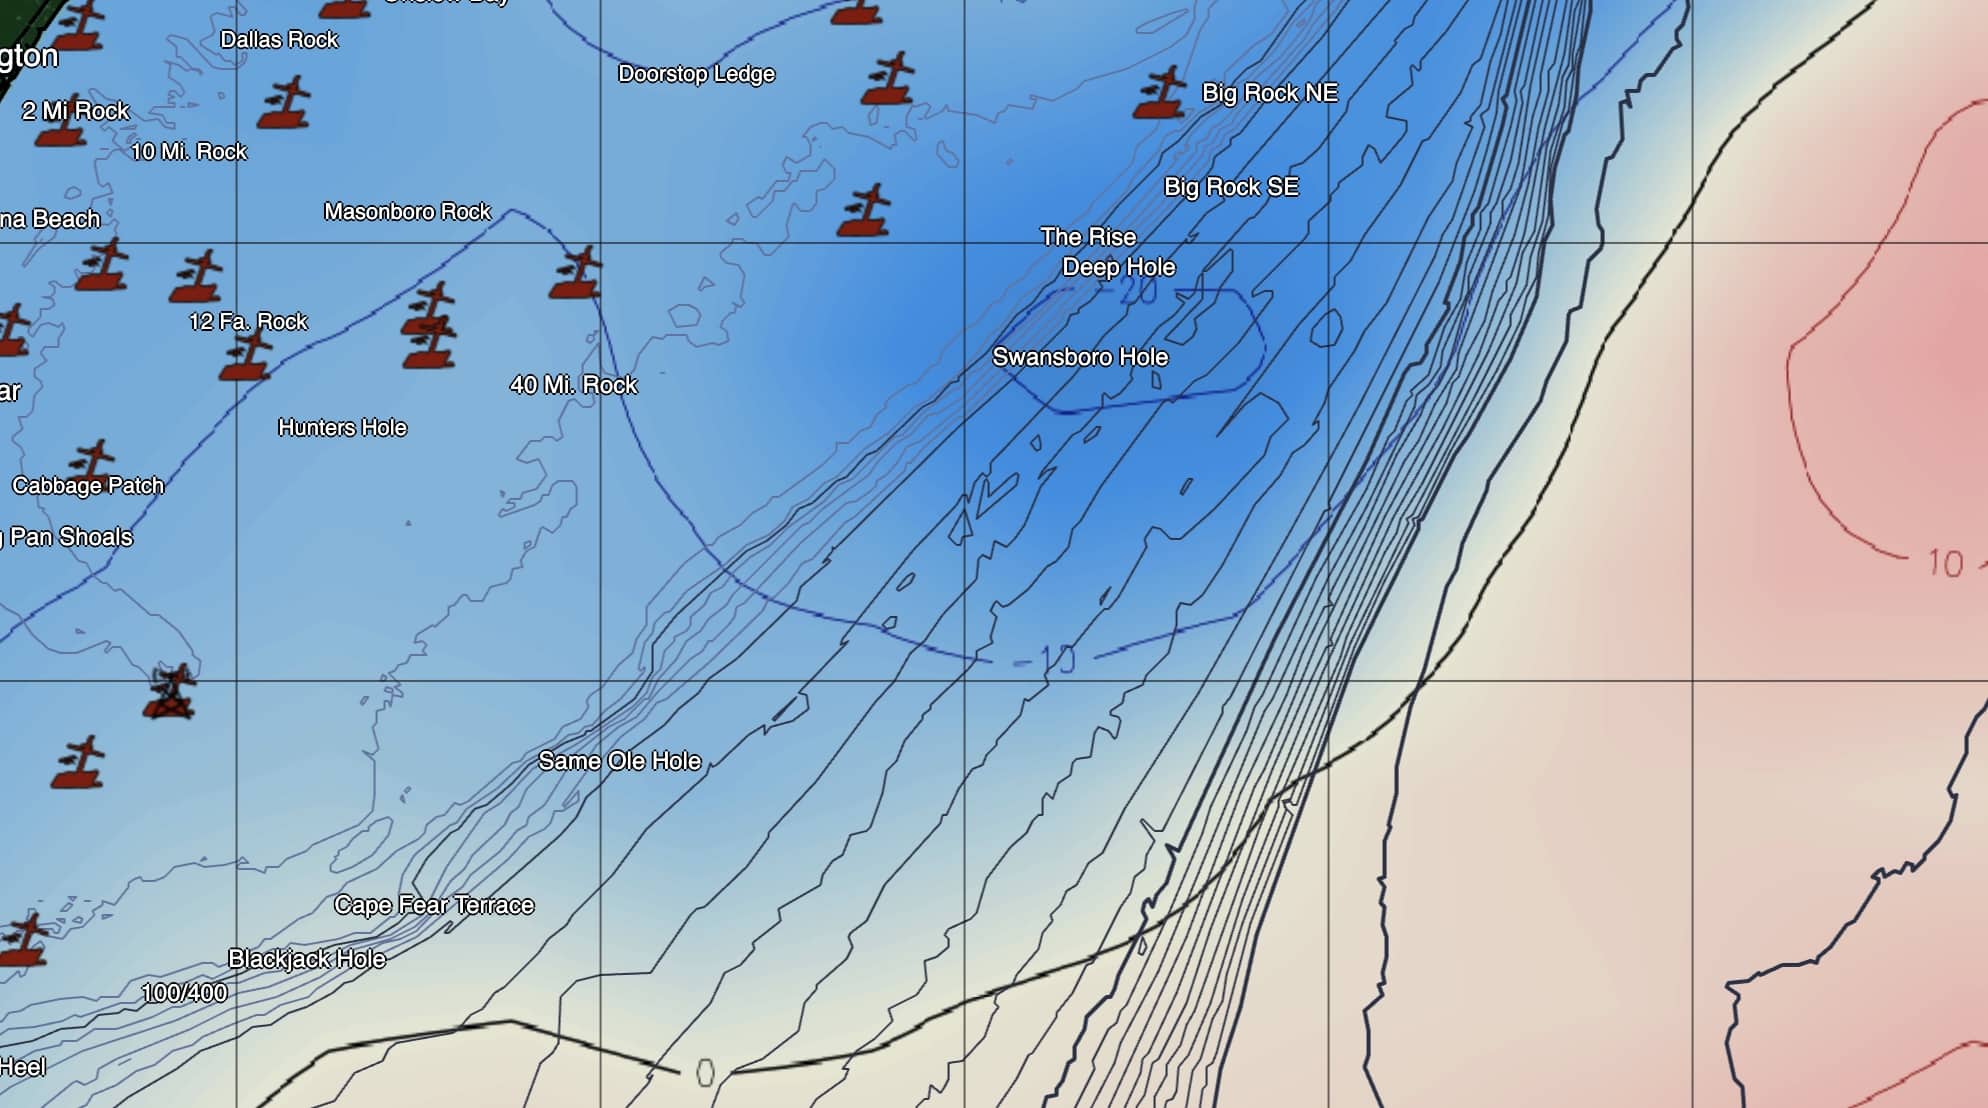
Chlorophyll data on SatFish highlights areas of higher biological activity, often pointing to zones where nutrients are present and baitfish are likely to gather. While many anglers assume green water automatically means dirty water, that isn’t always the case offshore. In the right context, chlorophyll edges can be incredibly productive.
After finding a solid SST break, I layer on chlorophyll to refine my target area. I’m not just looking for the greenest water on the screen. Instead, I focus on transitions — places where slightly greener water meets clearer blue water along an edge. These transition zones often indicate bait concentrations and active feeding zones.
By combining SST and chlorophyll, I’m no longer just fishing warm water — I’m fishing warm water that has life in it. That distinction matters, especially in winter when fish tend to be more spread out and efficient feeding zones are critical.
This approach has consistently helped me narrow large offshore areas into smaller, more manageable zones with a higher probability of producing wahoo. It’s another step toward fishing smarter instead of covering endless miles of water.
Temperature tells me where the Gulf Stream is. Chlorophyll helps me decide where the food chain is active. In the next section, I’ll add the third layer — altimetry — and explain how I choose which of those areas is actually worth fishing first.
Fine-Tuning Your Wahoo Hunt: Using Altimetry Data with SatFish
By the time I’m looking at altimetry, I already have a short list of good-looking areas. SST has shown me the warm water. Chlorophyll has shown me where life may be present. Altimetry helps me decide which of those areas deserves my time.
Once you locate an area of interest, stack layers (SST, Chloro, & Altimetry) and look for alignment in all three.
Altimetry data on SatFish displays sea surface height anomalies — subtle rises and dips in the ocean’s surface caused by currents, pressure, and subsurface structure. While these changes may look small on the screen, they often indicate powerful processes happening below the surface.
Areas where the sea surface is slightly depressed can signal upwellings, where nutrient-rich water is being pushed upward. These upwellings can stack bait in otherwise featureless blue water. Conversely, areas where water piles up may be less productive. Altimetry helps me see those differences before I ever leave the dock.
When I overlay altimetry on top of my SST and chlorophyll maps, I’m looking for alignment — subtle height anomalies that coincide with temperature breaks and biological edges. These intersections often become priority zones where bait and predators naturally intersect.
Altimetry doesn’t replace the other layers. It confirms them. It’s the tool that helps me choose which edge gets my first pass and which areas can wait.
In one recent example, a subtle height anomaly identified on SatFish lined up perfectly with what we later confirmed as an upwelling well below the surface. That kind of validation reinforces why altimetry plays such a key role in my offshore planning.
In the final section, I’ll show how all three layers come together — temperature, chlorophyll, and altimetry — to form a repeatable, real-world trip-planning approach using SatFish.
Putting It All Together: How I Plan Winter Wahoo Trips with SatFish
Planning a winter wahoo trip isn’t about chasing a single data point. It’s about understanding how multiple variables work together and using them to make informed decisions before the boat ever leaves the dock.
When I sit down to plan a trip with SatFish, I start wide and work my way in. First, I identify where the Gulf Stream and its edges are positioned using sea surface temperature. That gives me the big picture and sets my general direction.
Next, I layer in chlorophyll to see where life is most likely to be present along those temperature breaks. This step helps eliminate water that looks good on temperature alone but lacks biological activity.
Finally, I bring in altimetry to fine-tune the plan. Subtle sea surface height anomalies help me decide which edges are most likely to concentrate bait and predators. By the time all three layers are considered together, I’m no longer guessing — I’m making deliberate choices based on how the ocean is behaving as a system.
This approach doesn’t guarantee fish, but it consistently puts me in the right water with confidence. Especially in winter, when conditions can change quickly and fuel and time matter, that confidence is invaluable.
SatFish allows me to move seamlessly between datasets, evaluate conditions objectively, and build a plan that adapts to what the ocean is actually doing — not what I hope it’s doing.
That’s how I approach winter wahoo fishing out of Carolina Beach. One layer at a time, one decision building on the next, and always letting the water tell the story.