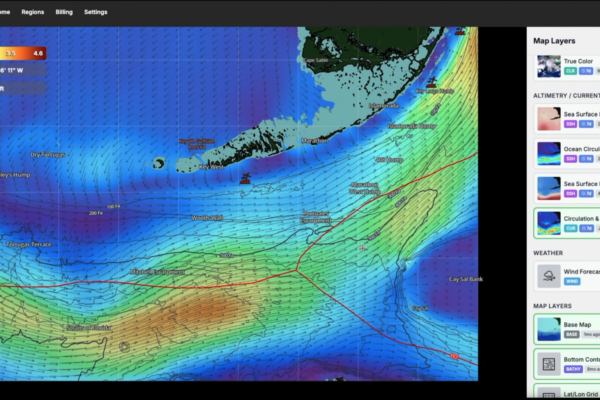
This is a wahoo fishing game plan for the Thunderbolt wreck off Marathon. It’s built from the new SatFish HD bathymetry chart (a high-definition map of the ocean floor) below and the daily tide data from the closest NOAA station. The Thunderbolt sits on the 20-fathom (120 ft) line — that’s the exact edge where the reef drops off into deep water, and it’s where two forces meet: the Gulf Stream (a big river in the ocean) and the daily tide. Here’s the wreck, the tides, the two forces, and six simple plans for fishing this spot on any given day.
WHAT THIS NEW CHART SHOWS
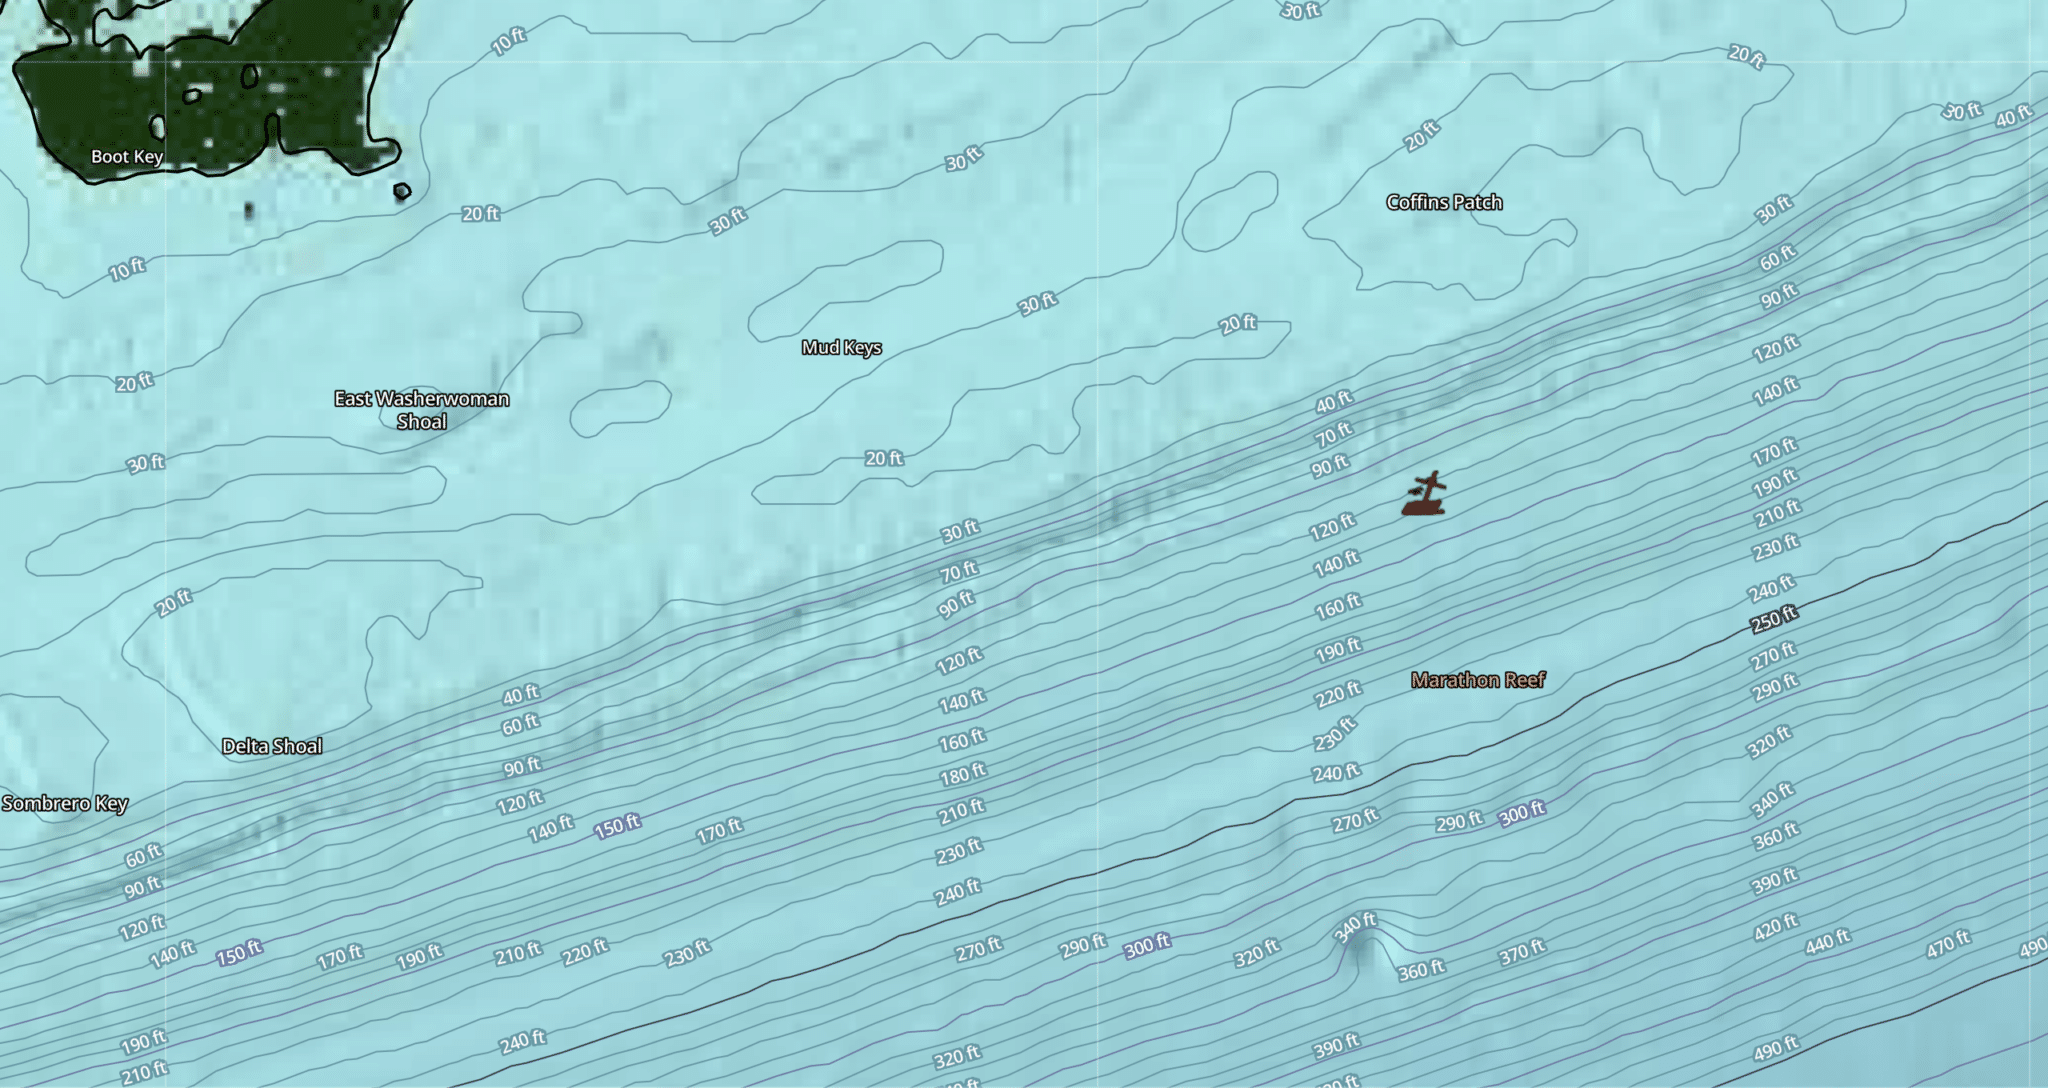
This is the new SatFish HD Bottom Contour Chart — a high-resolution map of the ocean floor off Marathon. Unlike the old chart, this one labels every depth contour in feet (not fathoms), and the resolution is sharp enough to read the exact shape of the shelf edge. The chart runs from the shallow inshore waters (10 ft) all the way out to the deep offshore (490 ft), and every major underwater landmark in the Thunderbolt’s neighborhood is labeled by name.
The single most important thing on this chart is the reef edge — the steep drop-off that runs diagonally across the image from the southwest to the northeast. That edge is the shelf break, and the Thunderbolt wreck sits right on top of it. Every wahoo fishing game plan is built on what that edge does to the current.
THE LANDMARKS ON THIS CHART
Here’s every labeled feature on the chart, from shallow (inshore) to deep (offshore), and what each one tells you:
Boot Key (top left, land)
This is actual land — the island of Boot Key, part of Marathon. It’s your reference point for “inshore.” Everything to the right (east) of Boot Key is open water getting progressively deeper as you move offshore.
East Washerwoman Shoal (left center, shallow)
A shallow shoal sitting in the pale cyan/teal water (10–30 ft). Shoals like this are inshore features — you pass over them on your way out to the wreck. They hold bait.
Mud Keys (center, shallow)
Another shallow inshore feature, sitting in the light teal water. The Mud Keys are a known bait-holding area. When you’re running out from Marathon to the Thunderbolt, you’ll pass the Mud Keys on your way to the edge.
Coffins Patch (top right, shallow-to-mid)
A patch reef sitting in the shallow-to-mid water on the north side of the chart. Coffins Patch is a well-known fishing spot in its own right. On the live SST chart (see the “Live SST Read” section below), the upwelling cold core is pinned to the wall right south of Coffins Patch — which puts it right on the Thunderbolt’s edge. This is one of the absolute best Florida Keys bait spots.
Delta Shoal (bottom left, shallow)
Another shallow shoal on the south side of the chart, in the pale teal water. Like the other shoals, it’s an inshore feature you pass on the run out.
Sombrero Key (far bottom left, shallow)
The far western reference point on this chart. Sombrero Key is a well-known reef and light station. It’s outside the Thunderbolt’s immediate area but helps you orient the chart — it tells you the chart covers the Marathon-to-Sombrero stretch of the Middle Keys.
Marathon Reef (deeper water, below the shelf drop-off)
This is the deep reef feature sitting in the darker blue water below the shelf drop-off. “Marathon Reef” is the live-bottom area on the offshore side of the wall.
The Thunderbolt Wreck Icon (brown ship marker, on the shelf edge)
The brown ship/wreck icon is the Thunderbolt. It sits right on the edge of the shelf, in the depth zone between 90 ft and 120 ft. That’s the exact spot where the bottom drops away fast — you can see how the contour lines bunch together right at the wreck. That bunching is the steep drop-off, and it’s the whole reason the wreck fishes the way it does for wahoo, permit, mutton snapper, african pompono, and more.
READING THE DEPTH CONTOURS (IN FEET)
This new chart labels depth in feet, and the contour lines are dense and easy to read. The lines run generally from the southwest to the northeast, parallel to the coast. Here’s how to read the three depth zones on this chart:
The Shallow Shelf (10–40 ft, pale cyan/teal)
The pale cyan/teal water inshore is the shallow shelf — 10 ft, 20 ft, 30 ft, and 40 ft contour lines. This is the water you run across leaving Marathon. It’s too shallow for the Thunderbolt game plan, but it’s where the bait lives. The shoals (East Washerwoman, Mud Keys, Delta Shoal) all sit in this zone.
The Shelf Drop-Off (60–240 ft, the steep wall)
This is the most important zone on the chart. The contour lines bunch tight together here — 60 ft, 70 ft, 90 ft, 120 ft, 140 ft, 150 ft, 160 ft, 170 ft, 180 ft, 190 ft, 210 ft, 220 ft, 230 ft, and 240 ft all packed into a narrow band. That tight bunching means the bottom is dropping away fast — this is the wall, the shelf break. The Thunderbolt wreck sits right in this zone, between the 90 ft and 120 ft lines. The water color here shifts from teal to deeper blue. This is where the current hits the wall and creates the swirls, shear zones, and upwellings that fire the bite.
The Deep Offshore (250–490 ft, dark navy/blue)
The dark navy/blue water offshore is the deep zone — 250 ft, 270 ft, 290 ft, 300 ft, 320 ft, 340 ft, 360 ft, 370 ft, 390 ft, 420 ft, 440 ft, 470 ft, and 490 ft. The contour lines spread back out here, meaning the bottom is flattening off into deep water. This is where the Gulf Stream runs and where Plan E sends you when the wall pushes offshore. Marathon Reef sits in this zone.
THE SHELF EDGE — THE MOST IMPORTANT FEATURE ON THIS CHART
The single most important thing to understand on this chart is the shelf edge — the steep drop-off that runs diagonally across the image from the southwest to the northeast. You can see it as the band where the contour lines bunch tightly together and the water color shifts from light teal to deep blue. That edge is the wall.
Here’s why the shelf edge matters so much for the Thunderbolt:
The Wreck Sits on The Edge
The Thunderbolt icon is right on the shelf break, between 90 ft and 120 ft. That means the wreck is sitting in the fastest part of the current — right where the water has to squeeze over the wall.
The Edge Creates the Swirl.
When the current hits the wall, the water has to go up and over. That deflection creates the eddy (swirl) behind the wreck — the calm pocket that traps bait.
The Edge is Where Upwelling Happens
When the Florida Current pushes in close, it hits the wall, and part of the flow deflects upward, bringing cold, nutrient-rich deep water up onto the reef. That’s the upwelling you see on the Live SST Read section below.
The Edge is the Highway
Pelagic fish (wahoo, tuna, mahi) run along the edge because that’s where the bait gets trapped. When the warm blue water is pinned on the edge, the highway is running right over the wreck.
On this chart, look at how the contour lines bunch together right where the wreck icon sits. That bunching is the steep drop-off. The tighter the lines, the steeper the wall. The Thunderbolt is sitting on one of the steepest parts of the Middle Keys shelf edge — and that’s exactly why it fishes so well.
Ready To Start Catching Wahoo Consistently-Join Our New Advanced Wahoo Playbook 8 Week Intensive
Inside the new Advanced Wahoo Playbook 2026–27 Intensive, you get eight weeks of comprehensive breakdown, live Q&A, and direct access to top-tier expertise.
There will be a Deep-dive session with Dr. Jeffery Barr, PhD, and Chief Scientist at SatFish, sharing critical offshore insights and strategy. This is your opportunity to learn from some of the best in the industry.
Claim Your Spot in the 8-Week Intensive & Bonus Q&A to turn these contour lines into consistent wahoo in the box this season.
How to Read the New HD SatFish Bottom Map
SatFish just updated their bottom maps to a new high-definition (HD) shaded-relief bathymetry chart. “Bathymetry” is just a fancy word for “a map of the ocean floor.” Think of it like a hiking trail map, but underwater — it shows you every canyon, ledge, pinnacle (tall spike), and seamount (underwater mountain) on the bottom. The new HD map makes all of these features easy to spot. Here’s how to read it, in plain English.
HOW THE COLORS WORK
The colors tell you how deep the water is. Shallow water is pale blue, and as the bottom gets deeper, the color shifts to darker blue and then purple. It’s like looking at a swimming pool — the shallow end looks light blue, and the deep end looks dark blue. Same idea, just on the whole ocean.
The colors on this chart tell you the depth at a glance.
Here’s the key:
Pale cyan/teal — the shallowest water (10–40 ft). This is the inshore shelf where the shoals sit.
Medium blue — the mid-depth water (60–120 ft). This is the shelf drop-off zone — where the wreck sits.
Deep navy/blue — the deep offshore water (250–490 ft). This is where the Gulf Stream runs and where Marathon Reef sits.
The transition from pale cyan to deep blue is the shelf edge. The sharper the color transition, the steeper the drop-off. On this chart, the color changes fast right at the wreck — another sign that the wall is steep right there.
The shading also shows you the texture of the bottom. Rough, “textured” areas are hardbottom and rocky reef. Smooth, flat areas are sand or mud. Why does that matter? Because baitfish, mutton snapper, blackfin tuna, sailfish, and wahoo all like the hard, rocky stuff — that’s where food and shelter are. The smooth sand and mud are mostly empty. On the chart above, you can see the rocky reef tract (textured) sitting right next to the smoother sand flats offshore. The wreck sits on the edge where the two meet.
READING THE DEPTH LINES (CONTOURS)
The lines on the map are depth contours — lines that connect points of the same depth. Think of them like the lines on a topographic hiking map. Here’s the key trick: the closer the lines are to each other, the steeper the drop-off. When the lines are bunched tight together, that means the bottom falls away fast — a sharp wall or ledge. When the lines are far apart, the bottom is flat and gently sloping.
Steep drop-offs are important because that’s where current hits the wall and creates the swirls and upwellings that concentrate bait. On the chart above, look at how the 20 Fa (120 ft) and 30 Fa (180 ft) lines bunch together right where the wreck sits — that’s the shelf break, the steep edge where the reef drops into deep water. That’s the whole reason the wreck fishes the way it does.
SatFish highlights the major depth lines at 100, 500, 1000, 1500, and 2000 fathoms, with extra lines added when you zoom in. Different fish like different depths, so watching these lines helps you track where the fish will be holding as the conditions change.
DEPTH CONVERSION KEY (1 FATHOM = 6 FT)
This new chart labels depth in feet. The rest of this game plan uses fathoms (Fa) because that’s how offshore charts traditionally mark the edge. Here’s the cheat sheet to switch between the two:
10 Fa = 60 ft 15 Fa = 90 ft (wreck zone)20 Fa = 120 ft (wreck zone) 30 Fa = 180 ft 40 Fa = 240 ft 50 Fa = 300 ft 60 Fa = 360 ft 70 Fa = 420 ft 80 Fa = 480 ft (deep offshore)90 ft = top of wreck zone 120 ft = wreck max depth 490 ft = deepest on this example chart
WHY PINNACLES AND SEAMOUNTS MATTER
Out in the open ocean, pinnacles (tall spikes from the bottom) and seamounts (underwater mountains) do something special: they create upwelling. Upwelling is when currents hit the tall structure and get pushed up toward the surface, carrying cold, nutrient-rich water with them. It’s like squeezing a tube from the bottom — the stuff at the bottom gets pushed to the top.
That nutrient boost builds plankton, the plankton attracts baitfish, and the baitfish attract the big pelagic fish (wahoo, tuna, mahi). So a seamount in the middle of nowhere can turn into a feeding hotspot, all because the structure pushed nutrients to the surface. The Thunderbolt wreck works the same way on a smaller scale — it’s a structure sitting in the current, creating the swirls that hold the food chain.
PUTTING IT ALL TOGETHER: BOTTOM + TEMPERATURE + CHLOROPHYLL
The real power of the HD bottom map is when you stack it with the other SatFish layers. Here’s how to use them together at the Thunderbolt:
- Bottom map (bathymetry): Shows you WHERE the structure is — the wreck, the 20 Fa (120 ft) edge, the drop-off. This is the fixed part. It doesn’t move.
- SST (sea surface temperature): Shows you the warm and cold water. Find the temperature band for your season (see the seasonal guide below) and see where that water is sitting on the bottom map. If the warm water is pushed up on the edge, the wreck is live. If it’s pushed offshore, the edge is dead.
- Chlorophyll (water color): Shows you where the plankton and bait are concentrated. Clean blue water = low chlorophyll (pelagic water). Green water = high chlorophyll (bait water). Where the blue and green meet on top of a depth contour, that’s your spot.
The move: find the structure on the bottom map, then see if the right temperature water and the bait (chlorophyll) are sitting on top of it. When all three line up — structure + right temp + bait — you’re on fish.
SATFISH LABELED MARATHON FISHING SPOTS
SatFish also puts thousands of fishing spots right on the chart, labeled by their team of local experts. These aren’t random coordinates scraped off the internet — they’re the real, legit spots picked by people who actually fish the area. You can tap anywhere on the map and see the exact GPS coordinates, so you can find a spot and then see if a temperature edge or a color break has pushed into that zone on a given day.
For the Thunderbolt, the wreck icon on the chart above is one of those labeled spots. Pair it with the HD bottom, the SST, and the chlorophyll layers, and you can see exactly when the conditions are right to make the run.
QUICK QUESTIONS, PLAIN ANSWERS
What is bathymetry and why does it help me fish?
Bathymetry is a map of the ocean floor. It helps you fish because fish hold on structure — wrecks, ledges, drop-offs, seamounts. If you can see the structure, you can see where the fish are going to be.
How do I read the colors?
Pale blue = shallow. Dark blue and purple = deep. The shading also shows texture — rough areas are hard bottom and reef (where the fish live); smooth areas are sand or mud (mostly empty).
What do the depth lines mean?
They connect points of the same depth. Lines close together = steep drop-off (a wall). Lines far apart = flat bottom. Steep drop-offs are where current hits and creates the swirls that hold bait.
Why do seamounts and pinnacles matter offshore?
They cause upwelling — currents hit the tall structure and push cold, nutrient-rich water to the surface. That builds plankton, which brings bait, which brings the big fish. A seamount in open water can be a feeding hotspot.
Are the SatFish Fishing Spots just random coordinates?
No. They’re picked by local experts who actually fish the areas, not scraped off the internet. You can tap the map for exact GPS and then check if a temperature edge or color break has moved into that spot.
The bottom line on the HD map: The new HD SatFish bottom map lets you see the structure (the wreck, the edge, the drop-off), and then stack the temperature and the bait on top of it. Structure is fixed — it doesn’t move. The temperature and the bait do move. When all three line up over the Thunderbolt, that’s your day. Data courtesy of the Seafloor Mapping Lab at Cal State Monterey Bay, the U.S. Geological Survey, NOAA, and the GEBCO Compilation Group (2024). Not for navigation.