Sea surface height—altimetry in scientific parlance—tells you a lot about the oceanic environment and where you might catch more fish.
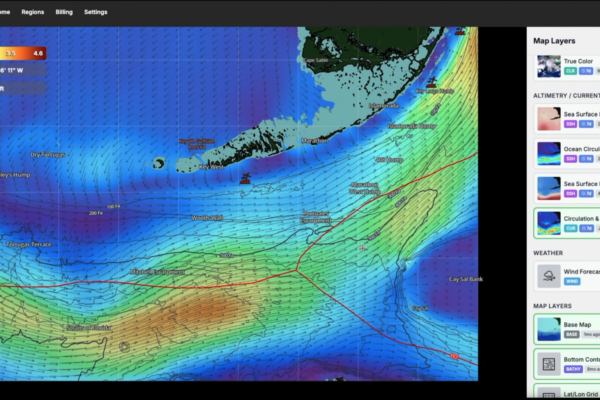
As you peruse SatFish and check out all the angling-centric intel available to you in addition to the SST data we all know and love, you’ll undoubtedly come across altimetry. This is sea surface height, which, despite our belief in sea level being, well, level, does change over time and from place to place. Satellites measure the time it takes a radar pulse to travel from space to the ocean and back, and can determine where there are bulges or dips in the surface. Then, since you’re a SatFish user, you can see where they are. Here’s what those charts are telling you and how to turn that data into bent rods.
Why Altimetry Matters
Sea surface altimetry can vary depending on several factors. Underwater mountains, for example, can cause a variation simply due to gravity. The mountain has to be massive to see this effect (about a mile high and several miles wide to create a bump in the ocean that satellites can detect), and it’s not likely to expose anything you don’t already know about from the bathymetry maps. But natural forces we encounter, like the friction between winds and currents, can also cause a small temporary change in altimetry. You’ve seen waves stand up taller when the wind and current are opposed, right? The principle is the same, just on a larger scale. Even more critically, upwellings, downwellings, and atmospheric pressure can have a similar impact, pushing down or pulling up on the water. And waters of different temperature and/or salinity are more or less dense, so they fill up more or less volume and cause more of those bulges and dips.
Why should you care about all this? Because areas where changes in altimetry occur, just like areas where changes in SST and chlorophyll are prevalent, tend to be zones where bait collects, and predators feed. Upwellings can have a huge effect, since they bring nutrient-rich waters up from down deep. When that water hits the sunlight, plankton bloom and supercharge the food chain. Water density changes indicate areas where you may see similar effects due to colliding currents. And often you’ll notice there’s a correlation of sorts between altimetry and SST.
How to Read Altimetry
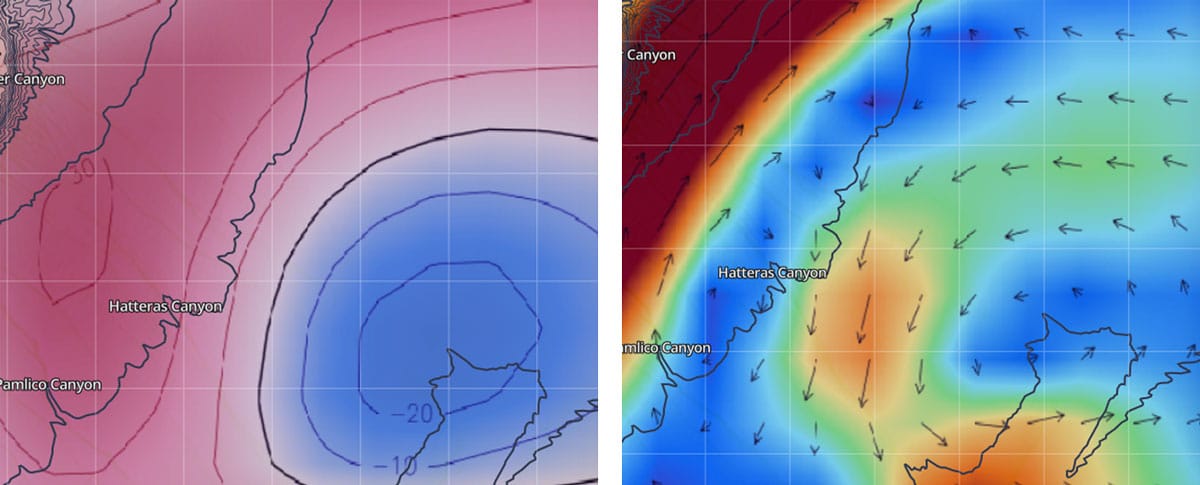
This can be a little tricky, and like anything else in fishing, it takes some interpretation and fish-brain to apply it successfully. Anomalies created by geography are, of course, more consistent than those created by conditions. Setting aside their importance for understanding bathymetry and deepwater structure, they don’t necessarily indicate conditions where fish will flock. Upwellings, on the other hand, can change frequently and create “breaks” of a sort which are of interest. But counter-intuitively, these don’t appear as an elevated area. Instead, they present as low points, because low areas are often where the water will be pushing upwards (to attain equilibrium). The edges of the low point are essentially the transition areas where there’s a “break.”
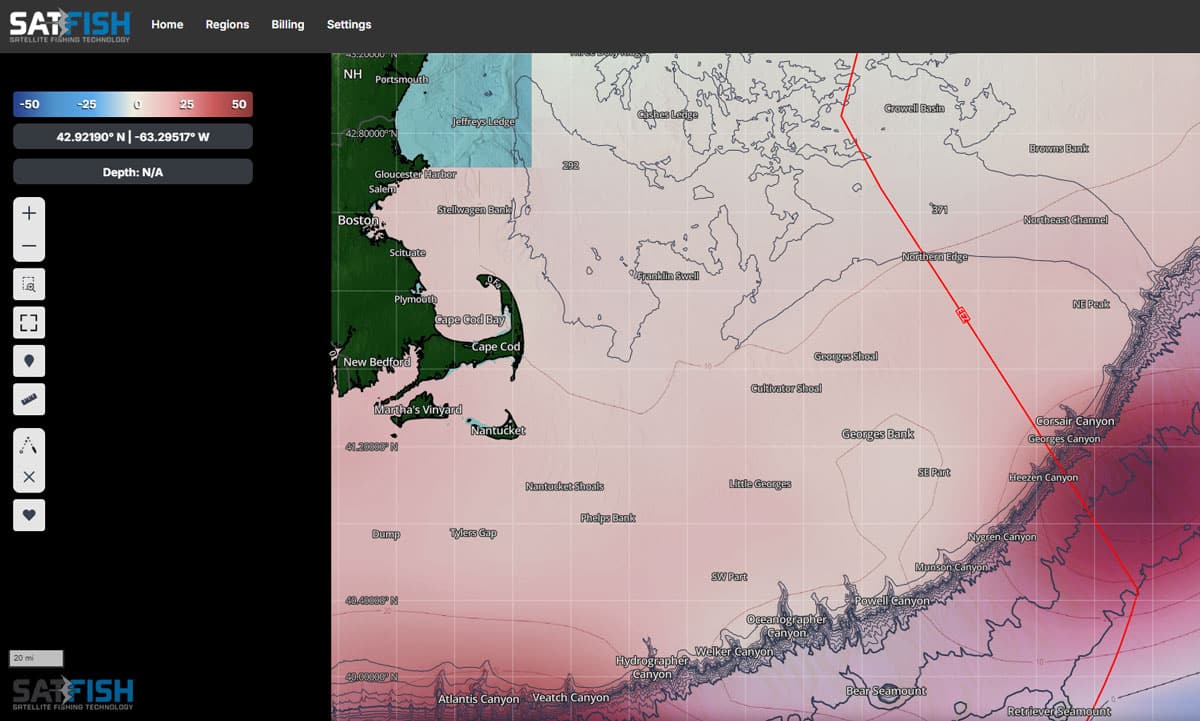
Altimetry changes created by temperature changes are probably the most important to eyeball. Warm water takes up more space than colder (denser) water, so it sits slightly higher than surrounding cooler waters. As an example, in most areas the Gulf Stream is commonly a meter or so higher than the surrounding cooler Atlantic waters.
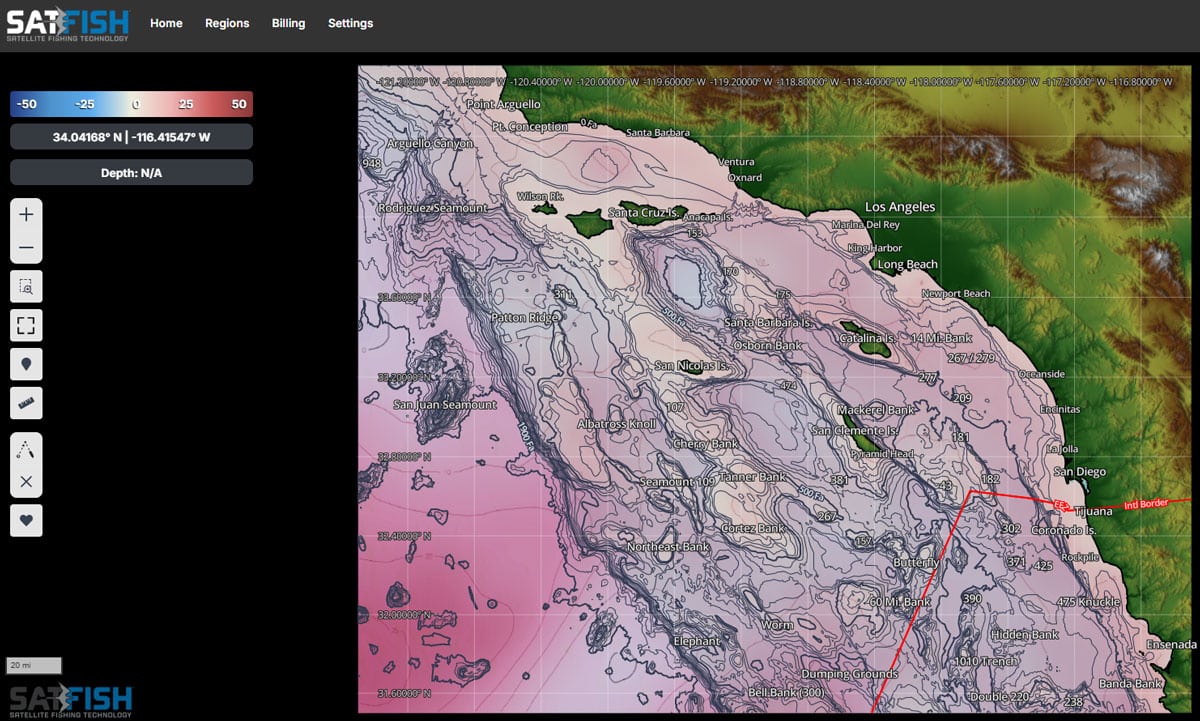
Note: altimetry data is best considered in areas 30 or more miles from the nearest land. Land and/or significant manmade structures can create distorted echoes where and when the satellite radar hits both land and water at the same time, and tidal distortions or rapidly transforming sea state (due to shallow water and complex bathymetry) can also have a derogatory effect. Within 20 miles of land, accuracy is generally considered to be just 10 percent, but beyond 30 miles from land, better than 90 percent.
Wait a sec—we already have SST, so why bother looking for changes in temperature versus just looking at the SST charts? Because altimetry isn’t easily degraded by cloud cover. This means that during problematic periods when cloud cover causes gaps in the SST, you can use altimetry as a backup of sorts. The altimetry and SST breaks won’t line up exactly, but the basic patterns and areas of change will mirror each other.
Let’s say you’ve been checking both SST and altimetry for three days prior to a trip. A break shows up clearly one day but is obscured the next. Comparing the SST with altimetry, you might be able to see that the area in question hasn’t changed. Or, you might be able to see that the corresponding altimetry rise shifted north—and understand that there’s a very good chance the SST break has shifted similarly, even though cloud cover might prevent you from seeing it. And it gets even better: on SatFish you can also use the Sea Surface Height Anomaly charts to see where there are unusual and drastic changes not related to geographic forces; contour lines similar to bathymetry lines make it clear where the biggest breaks are likely to be.
The Bottom Line on Altimetry
Putting together all the elements of offshore fishing is very much like putting together a puzzle. You need to present the right offering, in the right way, at the right time, in the right place. Altimetry gives you one more piece to the puzzle to consider, and it can help fill in some of the gaps that arise as you do your pre-trip planning. With a little luck, that will translate into one more thing you’re trying to piece together: a plugged fishbox.